7LEpaper2
Recognised text
Text below was produced by optical character recognition and may contain errors. Check it against the original.
504

L. W. EDWARDS

OCT. NOV. DEC. JAN. FEB. MAR. APR. MAY JUN. JUL. AUG. SEP.

4000;
kK
Zz
2
°
iW)
3000 |
3
8
0 20004
<
ct
¥
a
10004
1965
400
| oa
Z
3
3
fo)
300 |
73
a |
ae
Bo 200 |
2°
is4
Ww
>
<
ioo -

1966

DEC. JAN. FEB. MAR. APR. MAY JUN. JUL. AUG. SEP.

1966

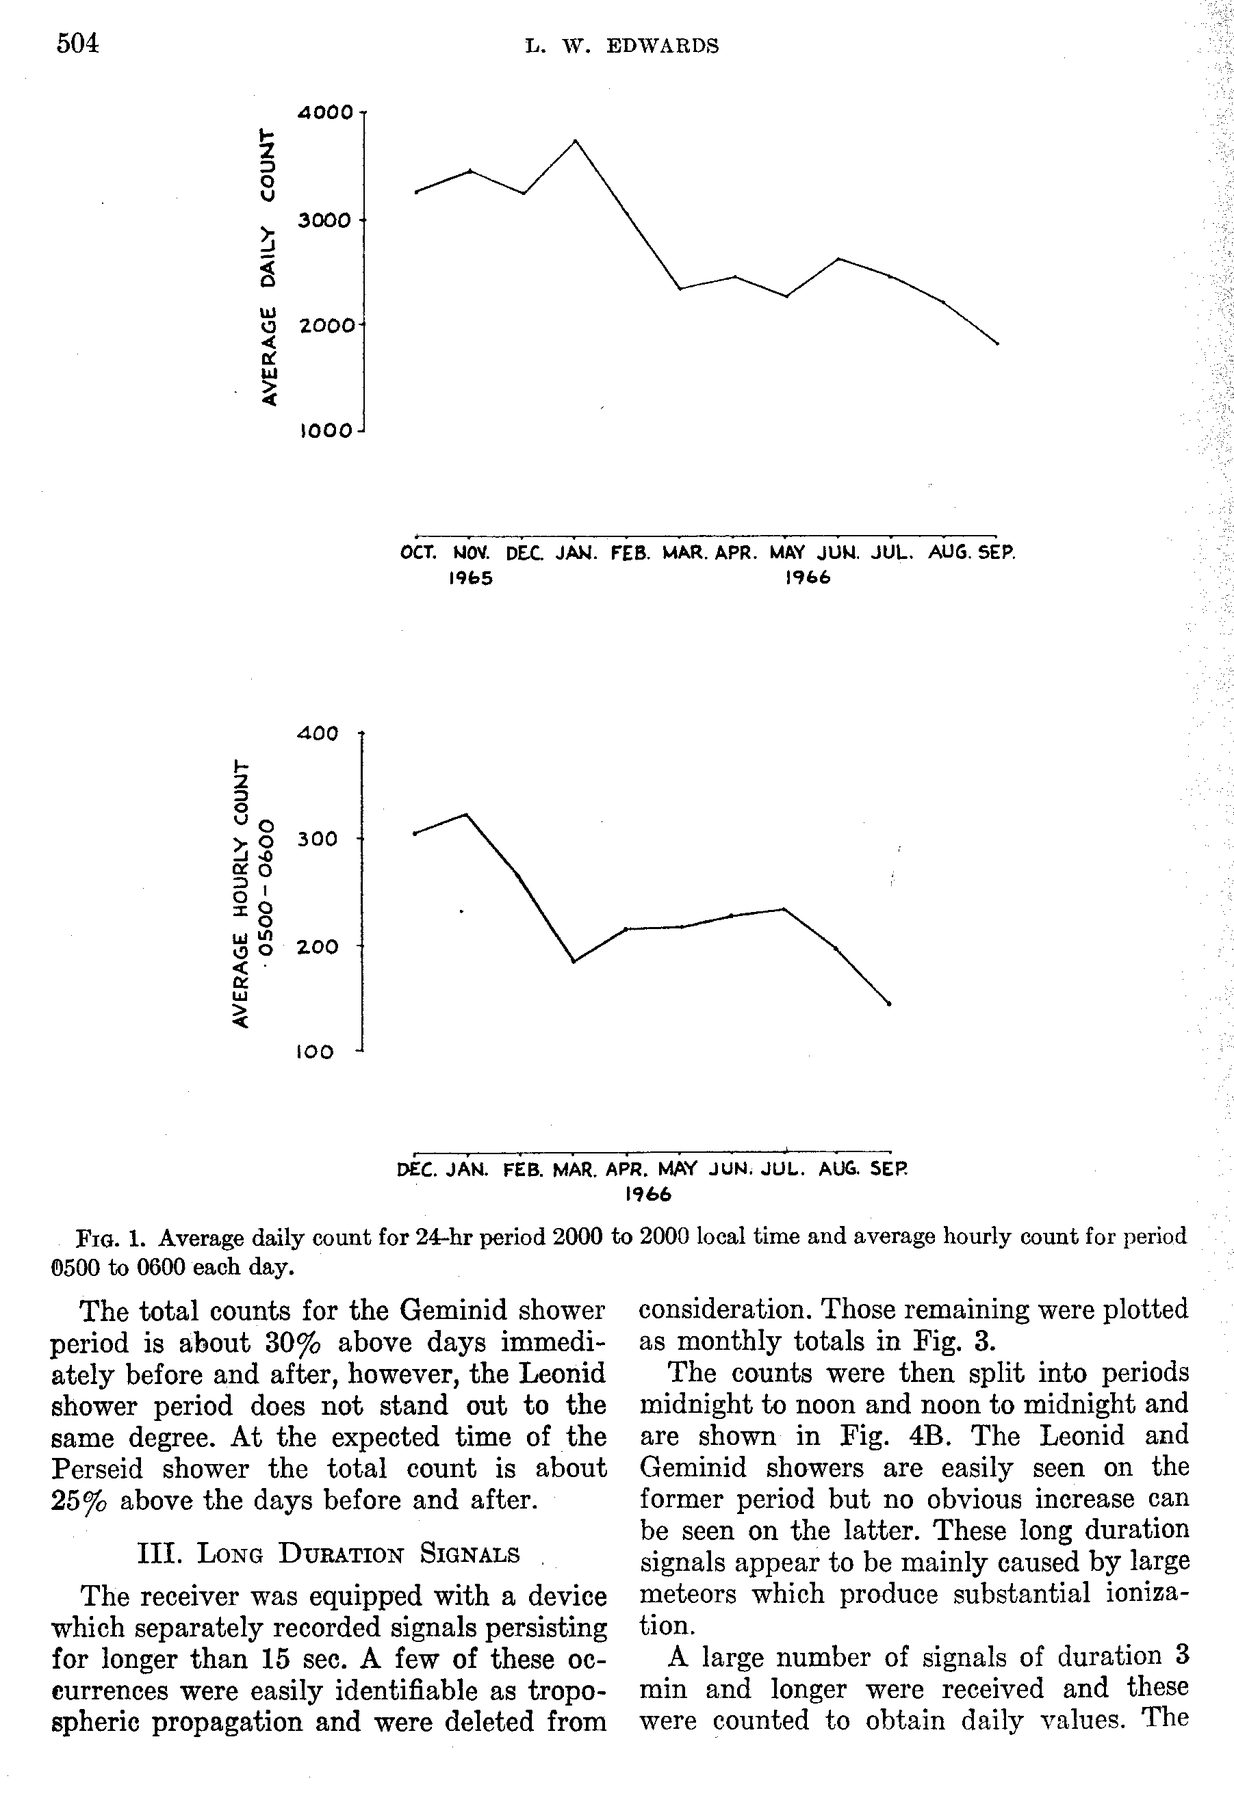
Fig. 1. Average daily count for 24-hr period 2000 to 2000 local time and average hourly count for period

0500 to 0600 each day.

The total counts for the Geminid shower
period is about 30% above days immedi-
ately before and after, however, the Leonid
shower period does not stand out to the
same degree. At the expected time of the
Perseid shower the total count is about
25% above the days before and after.

IIl. Long Duration SIGNALS .

The receiver was equipped with a device
which separately recorded signals persisting
for longer than 15 sec. A few of these oc-
eurrences were easily identifiable as tropo-
spheric propagation and were deleted from

consideration. Those remaining were plotted
as monthly totals in Fig. 3.

The counts were then split into periods
midnight to noon and noon to midnight and
are shown in Fig. 4B. The Leonid and
Geminid showers are easily seen on the
former period but no obvious increase can
be seen on the latter. These long duration
signals appear to be mainly caused by large
meteors which produce substantial ioniza-
tion.

A large number of signals of duration 3
min and longer were received and these
were counted to obtain daily values. The