DOC 001 Stanley 1937 2
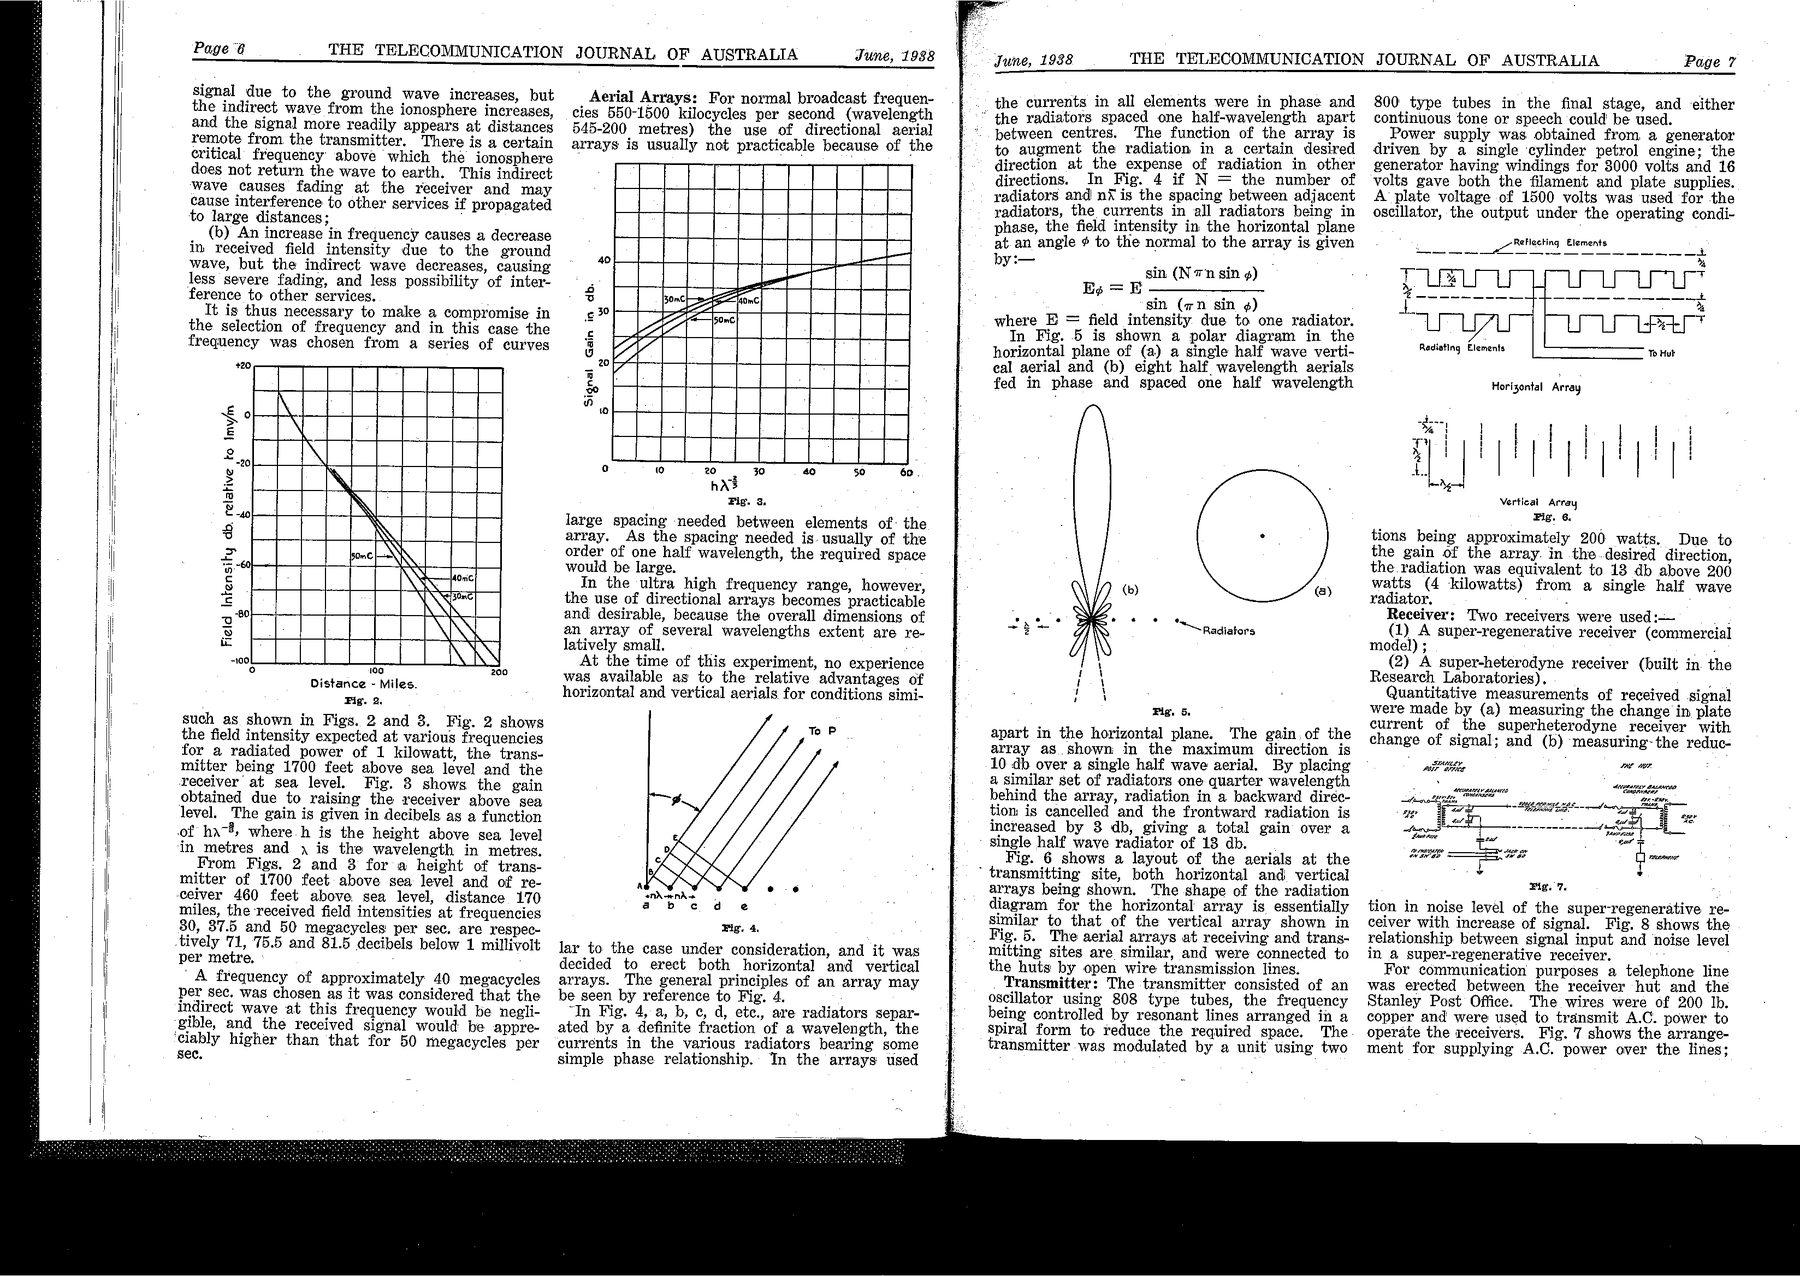
Recognised text
Text below was produced by optical character recognition and may contain errors. Check it against the original.
Page @

THE TELECOMMUNICATION JOURNAL OF AUSTRALIA

June, 1988

signal due to the ground wave increases, but
the indirect wave from the ionosphere increases,
and the signal more readily appears at distances
remote from the transmitter. There is a certain
critical frequency above which the ionosphere
does not return the wave to earth. This indirect
wave causes fading at the receiver and may
cause interference to other services if propagated
to large distances; ,

(b) An increase in frequency causes a decrease
in received field intensity due to the ground
wave, but the indirect wave decreases, causing
less severe fading, and less possibility of inter-
ference to other services.

It is thus necessary to make a compromise in
the selection of frequency and in this case the
frequency was chosen from a series of curves

+20

cs}

3
3

&

same |—w

Oni

NEE

-80.

Field Intensity db. relative to Imv/n

° 100 200
Distance - Miles.
Fig. 2.

such as shown in Figs. 2 and 3. Fig. 2 shows
the field intensity expected at various frequencies
for a radiated power of 1 kilowatt, the trans-
mitter being 1700 feet above sea level and the
receiver at sea level. Fig. 8 shows the gain
obtained due to raising the receiver above sea
level. The gain is given in decibels as a function

of ha’, where.h is the height above sea level

in metres and , is the wavelength in metres.
From Figs. 2 and 3 for a height of trans-
mitter of 1700 feet above sea-level and of re-

ceiver 460 feet above sea level, distance 170

miles, the received field intensities at frequencies
30, 87.5 and 50 megacycles per sec, are respec-

tively 71, 75.5 and 81.5 decibels below 1 millivolt

per metre.

"A frequency of approximately 40 megacycles
per sec. was chosen as it was considered that the
indirect wave at this frequency would be negli-
gible, and the received signal would be appre-

‘ciably higher than that for 50 tmhegacycles per

sec.

Aerial Arrays: For normal broadcast frequen-
cies 550-1500 kilocycles per second (wavelength
545-200 metres) the use of directional aerial
arrays is usually not practicable because of the

40 ama
pone]

2
co SOmC sete lam

30 -
is “2 —|50mC|
: La |
%
0

20 A
3
=
Po

a 0 wo, 6 40 50 60.
hrs
Fig. 3.

large spacing needed between elements of: the
array. As the spacing needed is- usually of the
order of one half wavelength, the required space
would be large.

In the ultra high frequency range, however,
the use of directional arrays becomes practicable
and desirable, because the overall dimensions of
an array of several wavelengths extent are re-
latively small. ; .

At the time of this experiment, no experience
was available as to the relative advantages of
horizontal and vertical aerials for conditions simi-

Big. 4.

lar to the case under consideration, and it was
decided to erect both horizontal and vertical
arrays. The general principles of an array may
be seen by reference to Fig. 4.

“In Fig. 4, a, b, ¢, d, etc., are radiators separ-
ated by a definite fraction of a wavelength, the
currents in the various radiators bearing some
simple phase relationship.. In the arrays used

June, 1938

THE TELECOMMUNICATION JOURNAL OF AUSTRALIA

Page 7

the currents in all elements were in phase and

“the radiators spaced one half-wavelength apart

between centres. The function of the array is
to augment the radiation in a certain, desired
direction at the expense of radiation in other
directions. In Fig. 4 if N = the number of
vadiators and ni is the spacing between adj acent
radiators, the currents in all radiators being in
phase, the field intensity in the horizontal plane
at.an angle ¢ to the normal to the array is given
by sin (N7n sin ¢)
Es = EF ———_______

sin (wn sin ¢)

where E = field intensity. due to one radiator.

In Fig. 5 is shown a polar diagram in the
horizontal plane of (a) a single half wave verti-
eal aerial and (b) eight half wavelength aerials
fed in phase and spaced one half wavelength

(b) @)

.
“Radiators

1
i \
fo \
i 4
Fig. 5.

apart in the horizontal plane. The gain.of the
array as.shown in the maximum direction is
10 db over a single half wave aerial. By placing
a similar set of radiators one quarter wavelength
behind the array, radiation in a backward dirée-
tiom is cancelled and the frontward radiation is
increased by 3 db, giving a total gain over a
single half wave radiator of 18 db.

Fig. 6 shows a layout of the aerials at the

transmitting site, both horizontal and. vertical

arrays being shown. The shape of the radiation
diagram for the horizontal array is essentially
similar to that of the vertical array shown in
Fig. 5. The aerial arrays at receiving and trans-
mitting sites are similar, and were connected to
the huts by open wire transmission lines.
Transmitter: The transmitter consisted of an
oscillator using 808 type tubes, the frequency
being controlled by resonant lines arranged in a
spiral form to reduce the required space. The
transmitter was modulated by a unit using two

800 type tubes in the final stage, and either
continuous tone or speech could be used.

Power supply was obtained from a generator
driven by a single cylinder petrol engine; the
generator having windings for 3000 volts and 16
volts gave both the filament and plate supplies.
A plate voltage of 1500 volts was used for the
oscillator, the output under the operating condi-

Horizontal Array

|

nn

Vertical Array
Fig. 6.

tions being approximately 200 watts. Due to
the gain of the array. in the. desired direction,
the radiation was equivalent to 13 db above 200
watts (4 kilowatts) from a single half wave
radiator. . -
Receiver: Two receivers were used :— :
(1) A super-regenerative receiver (commercial
model) ; .
(2) A super-heterodyne receiver (built in. the
Research Laboratories). :
Quantitative measurements of received signal
were made by (a) measuring the change in plate
current of the superheterodyne receiver with
change of signal; and (b) ‘measuring-the reduc-

smneey THE Mae.
Or aes

aegge er
Wee —- Ww

Fig. 7.

tion in noise level of the super-regenerative re-
ceiver with increase of signal. Fig. 8 shows the
relationship between signal input and noise level
in a super-regenerative receiver.

For communication purposes a telephone line
was erected between the receiver hut and the
Stanley Post Office. The wires were of 200 Ib.
copper and were used to transmit A.C. power to
operate the receivers. Fig. 7 shows the arrange-
ment for supplying A.C. power over the lines;

8 THE TELECOMMUNICATION JOURNAL OF AUSTRALIA

June, 1988

alephone: circuit worked earth return and
ower hum was found to be negligible in
lephone when suitably balanced condensers

ised.

Results of Tests:

eral: Receiving tests were made for a
of 11 days, from 29/9/87-9/10/37 using
\orizontal and vertical aerials,

mn transmitting on the horizontal aerial,

TNS eens amen ser ee

80!

@ (0 20 50 40 30 60 90 5 ~go jue
Input in db refatwe to' arbitrary level

s. §.—Super-regenerative Recelver Noise Level
plotted against signal input.

eived level was approximately 30 db better
horizontal than the vertical aerial. How-
vhen transmitting on the vertical aerial,
‘ived signal was only 10 db better on the
| than the horizontal. Occasionally when
the vertical aerial for transmitting, the
d signal was almost as strong on the
tal as on the vertical aerial. This would

2 that a change of the plane of polariza-.

as taking place—propagation favouring
tal polarization.
us: Horizontal polarization (horizontal
' proved to be consistently better than
. polarization, the difference at all times
least 20 db in favour of the horizontal.
iminary theoretical investigations it was
t that the horizontal aerial would radiate
proportion of the energy at high angles
horizontal (the calculated maximum en-
as at 18° to the horizontal). The high
f energy at an angle to the horizontal is
by wave interference between directly
ited radiation and radiation reflected from
und, and the above figure of 18° was ob-
assuming a flat earth and perfect re-
from the earth. At Tanybryn, however,
sund sloped downwards away from the
nd dropped suddenly about 100 feet out,
the flat earth theory would not apply
aly, and an increased signal in the hori-
at the expense of high angle radiation
ie expected.

_Fading: The received signal varied in inten-
sity throughout the day but the variations were
in all cases of slow period and no distortion was
noticed even when the received field was rela-
tively low. At no period during the tests was
there a complete absence of signal when trans-
mitting and receiving on the horizontal aerials.

Fig. 9 shows a curve.of received field inten-
sity during typical listening periods, and it is
of interest to note that the maximum variation
expected due to transmitter fluctuations was
approximately 1 db.

Effect of weather, time of day, ete.: During
the period of the tests the weather had no
noticeable effect, but it is possible that seasonal
changes may be noticed. This will be investi-
gated by long period observations on the channel.

The signal intensity at night appeared to-be
the same as during the daytime, the fading
noticeable on broadcast and high frequency pro-
pagation being absent.

Summary: The tests indicated that communi-
cation is possible over distances greater than
optical when using a frequency of approximately
40 megacycles per sec. but the long period re-
liability of such a circuit has yet to be estab-
lished. The present intention is to instal at
Stanley, Tasmania, a transmitter of 200-300
watts power and to take long period recordings

toes

EWAN

Tees tiay, |s-so-p7,  |Horiontall Reng ls

Signal miensity Lb above 1muerevolt.

£24, AX
“CROW
aa V\ M
+32
Wed. jO"03; Hore ertaf| Aeriays:

Fig. 9.—Variation of recelved signal intensity
' over typical Listening periods.

of the field strength received in Victoria. The
transmitter will be crystal controlled to prevent
any appreciable frequency change, and the re-
ceiver will be a superheterodyne type in which
the automatic volume control voltage will be used
to control the current through a triode tube
operating a recording milliammeter. Horizontal
aerials will be used at both the, transmitter and
receiver.

Recently the transmitter and receiver were
completed to provide an emergency service, but
the tests will be continued.

telephone cables.

June, 1938

THE TELECOMMUNICATION JQURNAL OF AUSTRALIA

‘Page 9

A SUBMARINE CABLE TRACER

It is almost a platitude to state that submarine
cable repairs are expensive. It is therefore im-
portant that every effort should be made to
facilitate repair work and to make best use of
the time for which the repair ship is chartered.
‘As bad weather is the principal cause of delay,
any means of using this time to assist the repair
js well. worth while. This can often be done

with the apparatus about to be deseribed.

When a submarine cable is laid, its position
ig carefully charted and splice sheets are pre-

pared to show the position of splices and the

percentage of slack laid over various portions of
the route. Owing to tides, currents and sub-
marine disturbances, it is possible for a cable
to be moved and so change its course or from
similar causes it may be buried. Naturally,
either of these effects would increase the time
of grappling unless some means is available for
detecting the true course of the cable from the
repair ship.. This facility is provided by the
Submarine Cable Tracer which will also show
the actual position of an earth fault, thus acting
as a confirmation of shore tests. It is particular-
ly useful when land sights are not available for
navigation.

Such equipment has been developed by the
Research Section of the British Post Office and
has been applied to our own requirements for
work in Bass Strait, both on the telegraph and
The essentials: are a low fre-
quency generator and a pair of search electrodes

Fig. 1—Cable Tracer Equipment.

to which are connected a tuned amplifier and
galvanometer, these being shown in the photo-
graph herewith. It has been shown that the
lower the frequency, the greater the ‘sensitivity
of the method. A 16.5 p.p.s. generator with an
output of 250 m.A. is connected to the cable and
earth at the cable hut so. that current paths
follow the cable route between the hut and the
earth fault (or earth connected to far end of
cable) in a fashion similar to lines of force be-

G.N. Smith, B.Se.

tween two unlike magnetic poles. The -current
paths may be considered as parallel to the cable
except near the fault and there are equipotential
surfaces perpendicular to these paths, that is at
right angles to the cable. .
Any two electrodes in the current paths will
have a potential difference between them pro-
vided they are not both in an equipotential sur
face. The measurement of potential drop. is
consequently made along the line of these current
paths, the maximum deflection being obtained
when over the cable. It is not necessary, how-
ever, in practice for the electrodes to be towed
exactly along the line of the cable, any crossing
up to an angle of 40 degrees being generally
satisfactory. A correction is then applied (read-
ing multiplied by cosine of angle of deflection)

wen aw’
ZEAE METER SOUECH DO ONLY DURING READINGS

Fig. 2.

to reduce the observed reading to a direction
along the lie of the cable.. As the ship pro-
gresses along the cable towards the earth fault
the deflections increase rapidly as the fault is
approached and: cease abruptly beyond it.

The electrodes may be towed “in line” about 30
fathoms behind the ship or, as is now preferred
by the British Post Office, “abreast” of the ship
by booms’ over the side so that they are in a
line at right angles to the ship. In the latter
case it is necessary, of course, for the ship to
cross and re-crogs the cable approximately: at
right angles. :

These electrodes consist of two brass log
rotators shorn of their fins, with a separation
of 10 fathoms between electrodes. Electrical
contact is maintained by means of cab-tyre flex.
In the case of the “in line’ method the tow line
is connected to a draw-bar spring and: the elec-
trodes are weighted, thus preventing sudden ~
movements and consequent spurious deflections
on, the amplifier galvanometer. The B.P.O. is
now experimenting with electrodes which dive
deeper as the towing’ speed increases thus re-
ducing the tendency for the electrodes to break
surface. It has been shown that the sensitivity
of the method is independent of the depth of the